The short answer
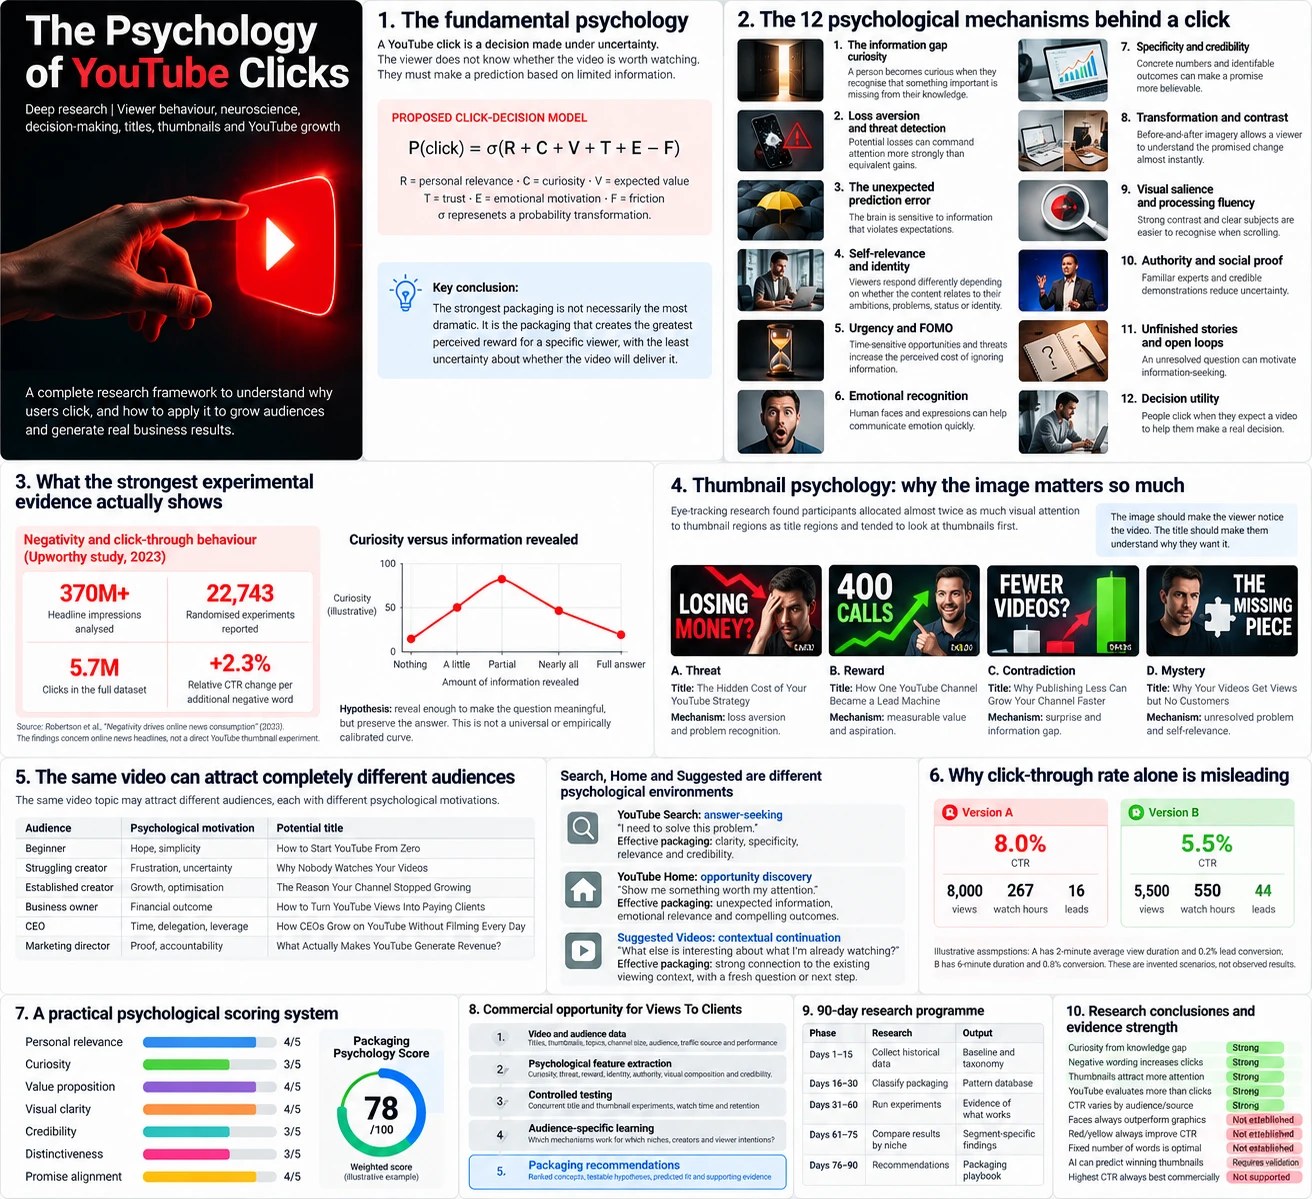
A viewer clicks when the expected reward of watching, for them, beats their doubt that the video will deliver it. The strongest packaging is not the most dramatic; it is the packaging that creates the greatest perceived reward for a specific viewer with the least uncertainty about delivery. Six things feed that prediction: personal relevance, curiosity, expected value, trust, emotional motivation, and friction (time cost and scepticism) working against them.
Two findings have strong evidence: curiosity comes from recognising a gap in your knowledge that looks closable, and thumbnails draw roughly twice the visual attention of titles. Several popular rules do not: that faces always beat graphics, that red and yellow always lift clicks, that there is an optimal number of thumbnail words, or that a tool can predict a winning thumbnail before it is tested.
The research on one page
The click as a decision under uncertainty
The viewer does not know whether the video is worth watching. They predict, from the thumbnail, the title, the subject, the creator and the videos around it, the answers to five questions: does this concern something important to me, will I learn or gain something or avoid a mistake, is there something surprising I want explained, do I trust this creator, and is the likely reward worth my time.
A useful way to write that down is a conceptual model: the probability of a click rises with relevance, curiosity, expected value, trust and emotional motivation, and falls with friction. This is not a validated YouTube formula; its value is that it separates six mechanisms that can be investigated and tested one at a time.
Twelve mechanisms behind a click
These draw on behavioural science, attention research and digital-media studies. Their effects overlap, and not all have been tested on YouTube specifically.
- The information gap (curiosity). A person becomes curious on recognising that something important is missing from their knowledge (Loewenstein, 1994). “Why smart entrepreneurs are suddenly abandoning this strategy” names a familiar group, an unexpected behaviour and a missing explanation.
- Loss aversion and threat detection. Potential losses can command attention more than equivalent gains. “7 mistakes costing your business customers” may beat a generic improvement headline; the size of the effect needs testing.
- The unexpected (prediction error). The brain is sensitive to information that violates expectation. “We doubled revenue by publishing fewer videos” is a contradiction the viewer wants resolved.
- Self-relevance and identity. Viewers respond to content that touches their ambitions, problems, status or identity. “Why experienced founders struggle to grow on YouTube” draws a narrower, more valuable audience than “How to get more views”.
- Urgency and fear of missing out. Time-sensitive opportunities raise the cost of ignoring information. Only usable where the prediction is genuinely substantiated.
- Emotional recognition. Faces, expressions and gaze communicate emotion quickly, but the exaggerated open-mouth thumbnail is not universally optimal; concern, relief and confidence make different promises, and whether a face helps depends on audience and recognition.
- Specificity and credibility. Concrete numbers and identifiable outcomes make a promise believable: “How 12 videos generated 400 sales calls” against “How to grow your business”, assuming the figures are real.
- Transformation and contrast. Before-and-after imagery lets the viewer grasp the change instantly; the title then explains how.
- Visual salience and processing fluency. Contrast, clear subjects and simple compositions are recognised faster when scrolling. Attracting the eye is not the same as earning the click.
- Authority and social proof. Familiar experts and credible demonstrations reduce uncertainty, when the authority is relevant to the promised outcome.
- Unfinished stories and open loops. “We changed one thing. Everything else improved.” Too vague and it backfires, because the viewer cannot tell whether the answer is relevant.
- Decision utility. People click when they expect the video to help them make a real decision: “Should you hire a YouTube editor or a strategist first?” Fewer viewers, more qualified.
What the strongest experiments actually show
The most relevant large experiment is Robertson and colleagues, “Negativity drives online news consumption”, Nature Human Behaviour, 2023. It analysed over 370 million headline impressions and 22,743 randomised experiments from Upworthy and found about a 2.3% relative rise in click-through per additional negative word in an average-length headline.
Read that carefully. A relative 2.3% means a 5.00% click-through becomes roughly 5.12%, not 7.30%. The setting was online news headlines, not YouTube thumbnails. It supports testing negatively framed headlines; it does not establish that negativity always wins or that every extra negative word helps on YouTube.
On curiosity, Loewenstein’s theory and later work on perceived knowability suggest curiosity depends on recognising a gap that looks possible to resolve. The working hypothesis: reveal enough to make the question meaningful, and keep the answer. “This changes everything” is too vague; “Using customer interviews helps you improve your video topics” gives the answer away; “We asked 100 customers why they click. One answer kept appearing” sets context, evidence and an open question. This curve is a hypothesis, not a measured one.
Why the thumbnail carries so much
An eye-tracking study of people browsing video sites (University of Florida) found participants gave roughly twice as much visual attention to thumbnail regions as to title regions, and looked at thumbnails first. The design principle that follows: the image makes the viewer notice the video; the title makes them understand why they want it. The exact ratio should not be assumed to hold on every modern YouTube surface.
Four thumbnail concepts worth testing, each with its mechanism: a threat (“LOSING MONEY?” with a title on the hidden cost of a strategy), a reward (“400 CALLS” with how one channel became a lead machine), a contradiction (“FEWER VIDEOS?” with why publishing less can grow a channel faster) and a mystery (“THE MISSING PIECE” with why videos get views but no customers). These are concepts to test, not proven winners.
Variables to test one at a time: face or no face; concern, surprise or neutral expression; gaze at the camera or at the object; no words or two to four; single object or before-and-after; brand-consistent or contrasting colour; a real screenshot or a conceptual graphic; a recognisable creator or an unknown; an explicit outcome or an implied mystery. And the one rule that holds across all of them: the thumbnail and title have different jobs but must make one coherent promise. If the thumbnail says “400 CALLS”, the title explains the method, not the same number again.
The same video, six audiences, six packagings
One video about building a channel can be packaged for a beginner (hope and simplicity: “How to start YouTube from zero”), a struggling creator (frustration: “Why nobody watches your videos”), an established creator (optimisation: “The reason your channel stopped growing”), a business owner (financial outcome: “How to turn YouTube views into paying clients”), a CEO (leverage: “How CEOs grow on YouTube without filming every day”) or a marketing director (accountability: “What actually makes YouTube generate revenue?”). The topic barely moves; the perceived reward changes completely. Packaging starts with the viewer’s motivation, not the thumbnail design.
Traffic sources are different psychological environments too, and YouTube confirms click-through varies by source and intent. Search viewers have a defined problem and reward clarity, specificity and credibility. Home viewers are discovering and reward unexpected information and compelling outcomes. Suggested viewers want a continuation of what they are watching with a fresh question. A title that is excellent for search can be weak on Home, which is why a universal thumbnail formula is unlikely to exist.
Why click-through rate alone misleads
YouTube’s recommendation system is built around long-term satisfaction, not clicks, and YouTube states that half of channels and videos sit in a broad 2 to 10% click-through range with large variation by audience and source. Its own title-and-thumbnail experiments pick winners by watch-time share, not click-through.
An illustrative example, with invented numbers: on 100,000 impressions, packaging A at 8.0% click-through gives 8,000 views; with a two-minute average view and a 0.2% lead rate that is 267 watch hours and 16 leads. Packaging B at 5.5% gives 5,500 views; with a six-minute average view and a 0.8% lead rate that is 550 watch hours and 44 leads. A wins the click and loses the business. Track three outcomes, in order: attention, satisfaction, commercial conversion.
A pre-publish scoring system, labelled as a proposal
A review that scores each title-and-thumbnail pair before publishing on seven questions: does the target viewer recognise their own problem (relevance), is there a meaningful unresolved question (curiosity), is the benefit of watching clear (value), can the central idea be recognised quickly (visual clarity), is the promise believable and supported (credibility), does it stand out against the competing videos (distinctiveness), and does the video deliver what the packaging implies (promise alignment). The weights are proposed priorities, not fitted coefficients; validate against a channel’s real performance before using any score to predict.
This is the point where VideoCore differs from a checklist. Rather than scoring a thumbnail by opinion, it counts which traits and constructions actually carried a higher share of winners across independent channels in your field, and shows the count. A trait that is a myth shows up as one.
What is established, and what is not
- Strong: curiosity arises from a perceived, closable knowledge gap (theory); negative wording raises online-news clicks by a small relative amount (experiment, that setting); thumbnails draw substantial visual attention (eye-tracking, limited generalisability); YouTube evaluates more than clicks and click-through varies by audience and source (platform documentation).
- Not established: faces always outperform graphics; red and yellow always improve click-through; a fixed number of thumbnail words is optimal; the best commercial thumbnail is the one with the highest click-through.
- Requires validation: that any tool can predict a winning thumbnail before it is tested.
The questions worth researching next are not “do faces work”. They are: which emotional mechanisms perform for which audience type; whether curiosity works better paired with a specific number; how viewers combine image and text; when visual complexity turns into confusion; how creator familiarity changes a thumbnail’s effect; which features produce commercially qualified viewers rather than traffic; and, most important, how much performance the subject itself explains before any packaging change. A compelling subject makes ordinary packaging work; a weak subject caps excellent execution. That is why the packaging decision comes second in Jake Trinder’s chain, after the topic.
See which traits actually won in your field
VideoCore counts title constructions and thumbnail traits across independent channels with the share of winners each carried. Lens shows the decode on any video, free.
Start free with your channel Get VideoCore Lens — free Read Jake Trinder’s five decisionsCommon questions
Why do people click on a YouTube video?
Because, in the second they see it, the reward they expect from watching outweighs their doubt that the video will deliver it. Six things feed that judgement: whether it is relevant to them, whether it opens a gap they want closed, the value they expect, how much they trust the creator, the emotion it triggers, and the friction of time cost and scepticism working against the click.
What is the information gap theory of curiosity?
George Loewenstein’s 1994 theory that curiosity arises when a person recognises that something important is missing from their knowledge. Later work adds that the gap has to look possible to resolve: a question that seems unanswerable produces less curiosity than one that seems a click away from an answer.
Do negative headlines get more clicks?
In a 2023 study of over 370 million Upworthy headline impressions and 22,743 randomised experiments, each additional negative word in an average-length headline raised click-through by about 2.3% relative, so 5.00% would become about 5.12%. That is a small, real effect in online news. It has not been shown to transfer directly to YouTube thumbnails or to hold for every added negative word.
Do viewers look at the thumbnail or the title first?
Eye-tracking research on people browsing video sites found they looked at thumbnails first and gave thumbnail regions roughly twice the visual attention of title regions. The practical rule is that the image gets the video noticed and the title explains why the viewer wants it. The exact ratio will vary across YouTube surfaces.
Do faces in thumbnails always get more clicks?
No, that is not established. Faces and expressions communicate emotion quickly, but whether a face helps depends on the audience, the context and whether the viewer recognises the creator. Different expressions make different promises, and the exaggerated open-mouth style is not universally better.
Is a high click-through rate always good?
No. YouTube ranks on long-term satisfaction, not clicks, and chooses the winner of its own title-and-thumbnail experiments by watch-time share. Packaging that wins the click but attracts the wrong viewer can produce less watch time and fewer leads than packaging with a lower click-through rate and the right viewer.
What is a good click-through rate on YouTube?
YouTube states that half of all channels and videos have click-through rates between 2% and 10%, with large variation by audience and traffic source. There is no single good number. Judge a video against your own channel’s normal and against who was shown it, not against a benchmark.
Why does the same video need different titles for different audiences?
Because the perceived reward changes with the viewer’s motivation. A beginner wants hope and simplicity, a struggling creator wants to know why nobody watches, a business owner wants a financial outcome, a CEO wants leverage without filming. The topic can stay the same while the packaging that earns the click changes completely.
Can a tool predict which thumbnail will win before testing?
That claim requires validation and should be treated as unproven. What can be done honestly is to count which thumbnail traits and title constructions carried a higher share of winning videos across many independent channels in a field, and then test the leading candidates on the channel itself.